Fermentation is the process of decomposing complex organic compounds into simpler substances under the action of microorganisms. Due to the near depletion of petroleum resources, the synthesis of biologically modified strains and the production of biochemicals through fermentation have become a new form of chemical production. After selecting the strains, process optimization and process control are the most effective ways to increase production capacity.
The testing of various chemical parameters during the fermentation process is the basis for process optimization. Currently, liquid chromatography and enzyme biosensors are mainly used for offline testing, which requires sample processing, long testing time, and chemical reagents, resulting in environmental pollution and consumables costs.
The Raman analyzer directly quantifies the complex components of the reaction solution by inserting a fiber optic immersion probe into the reactor, without the need for sample processing and consumables. The testing speed is fast and can instantly reflect small component changes caused by abnormal fermentation processes. Based on the testing process parameters, fully automatic analysis and replenishment control can be achieved.
The parameters that the Raman biological process analyzer can test include OD, biomass, glucose, various acids, lipids, salt ions, and products. It can basically test all high concentration components in a fermentation system, with a detection limit of 20-100mg/L.
A domestic university is developing a natural product based on fermentation technology. In the stage of optimizing the process and increasing production, it is particularly concerned about the concentration changes of various acids during the fermentation process to understand their impact on strain growth and yield.
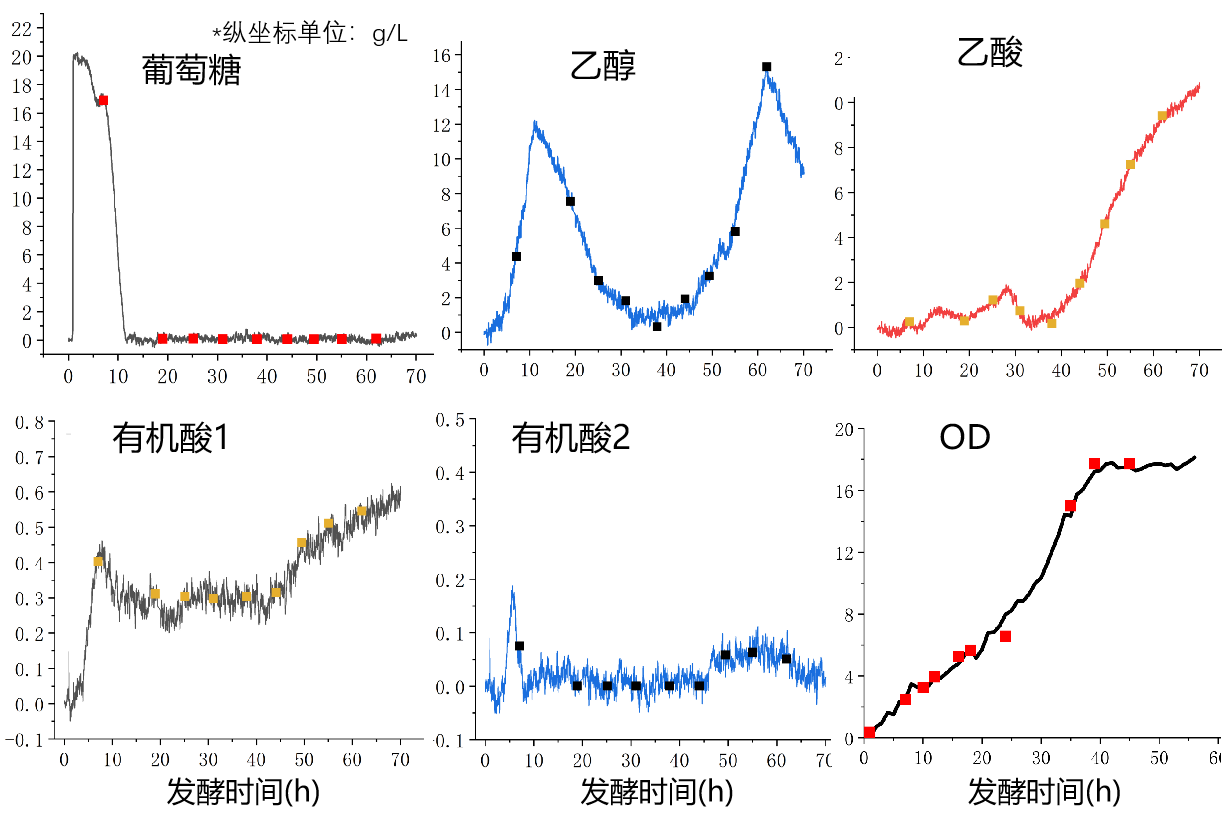
The sub wave photon Raman analyzer continuously tests two batches of fermentation online, and the customer simultaneously uses discrete sampling chromatography to test the standard values of these parameters. Using the first batch of standard values for modeling, predict the changes in the second batch of parameters over time as shown in the right figure. Discrete points are the standard values for chromatographic testing and have a high degree of agreement with Raman predicted values (with an error of less than 5%). However, Raman can continuously and real-time monitor the instantaneous changes of intracellular and extracellular substances in fermentation broth, providing data reference for controlling the growth status of strains and the quality and quantity of products.

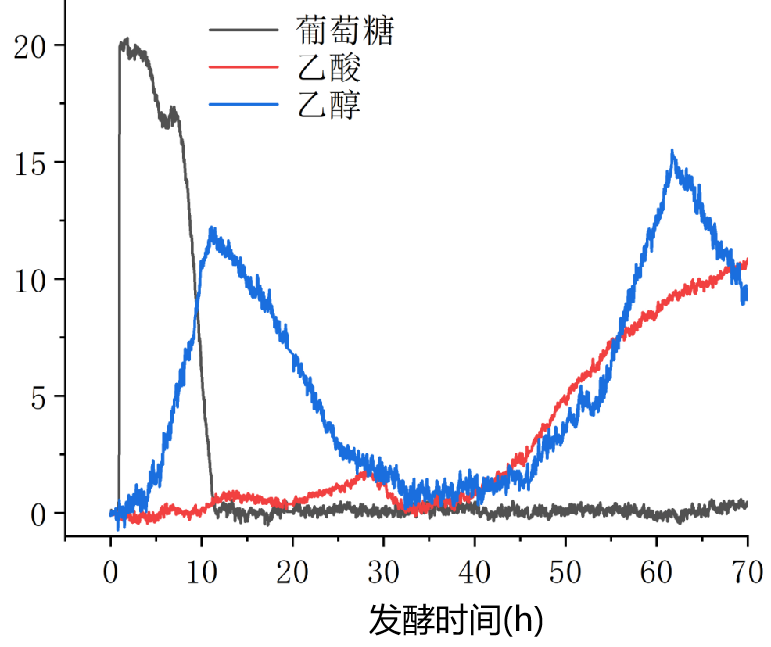
After overlapping the concentration curves of glucose, ethanol, and acetic acid with time, it can be observed that the ethanol content is very low in the early stage of fermentation. As the fermentation progresses, the consumption of sugar is accompanied by the accumulation of ethanol. After the sugar is consumed in the later stage (about 12 hours), ethanol begins to be consumed, and its concentration rapidly decreases until it remains in a stable state (35 hours). During the consumption of ethanol, the change in acetic acid is not significant. Starting from 45 hours, glucose was slowly added, and the strain rapidly converted glucose into ethanol, leading to a rapid increase in acetic acid. After the ethanol decreased in the later stage, acetic acid continued to increase.
